Archived content. This page is no longer actively maintained and may not function as intended. For the latest information and statistics visit the ABS Website.
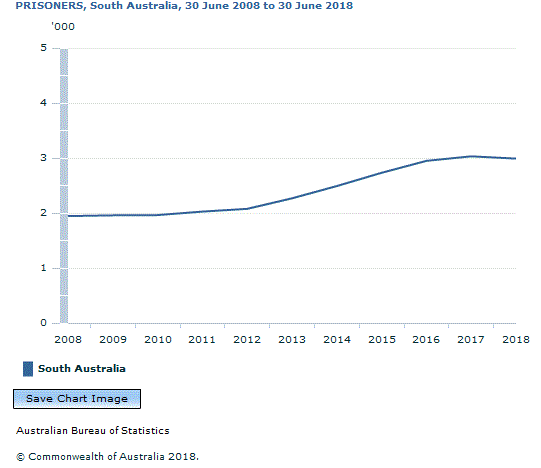
The number of adult prisoners in South Australian prisons was 2,991, a decrease of 1% (41 prisoners) since 2017. This was the only state or territory that had a decrease in prisoner numbers in 2018. (Table 15)
The adult imprisonment rate was 219 prisoners per 100,000 adult population, a decrease from 224 prisoners per 100,000 adult population in 2017. (Table 19)
Just over half of all prisoners (52% or 1,567 prisoners) had previously been imprisoned under sentence. (Table 14)
The most common offences/charges were:
Acts intended to cause injury (18% or 546 prisoners);
Sexual assault and related offences (14% or 416 prisoners);
Illicit drug offences (13% or 395 prisoners); and
Offences against justice (13% or 386 prisoners). (Table 16)
Sex
Males comprised 93% (2,771 prisoners) of the total prisoner population. (Table 14)
Since 30 June 2017, the male imprisonment rate decreased from 425 to 414 prisoners per 100,000 male adult population, while the female imprisonment rate remained stable at 31 prisoners per 100,000 female adult population. (Table 15)
Age
The median age of adult prisoners was 36 years of age, which was the highest median age of all states and territories. (Table 14)
Country of Birth
Overseas-born prisoners accounted for 12% of the South Australian adult prisoner population, with the largest proportion from the United Kingdom (22% of overseas born prisoners) followed by Vietnam (12% of overseas born prisoners). (Table 22)
Aboriginal and Torres Strait Islander Prisoners
Aboriginal and Torres Strait Islanders comprised 22% (661 prisoners) of the adult prisoner population. (Table 14)
The Aboriginal and Torres Strait Islander age standardised imprisonment rate was more than 11 times the non-Indigenous age standardised imprisonment rate (2,284 prisoners per 100,000 Aboriginal and Torres Strait Islander adult population compared to 198 prisoners per 100,000 adult non-Indigenous population). (Table 18)
Legal Status
Unsentenced prisoners comprised 37% (1,116 prisoners) of the adult prisoner population. This was the second highest proportion nationally in 2018. (Tables 14)
The median time spent on remand by unsentenced prisoners was 2.5 months. (Table 32)
For sentenced prisoners, South Australia had the highest national median aggregate sentence length (4.4 years, compared to the national average of 3.0 years), and median expected time to serve (3.2 years compared to the national average of 1.9 years). (Tables 25 and 26)
Document Selection
These documents will be presented in a new window.
 Quality Declaration
  Print Page
 Print All